Player Weariness Metrics Driving Shifts in Live Odds During Intense Multi-Competition Periods
Drew Braun · Sep 15, 2026
Player Weariness Metrics Driving Shifts in Live Odds During Intense Multi-Competition Periods
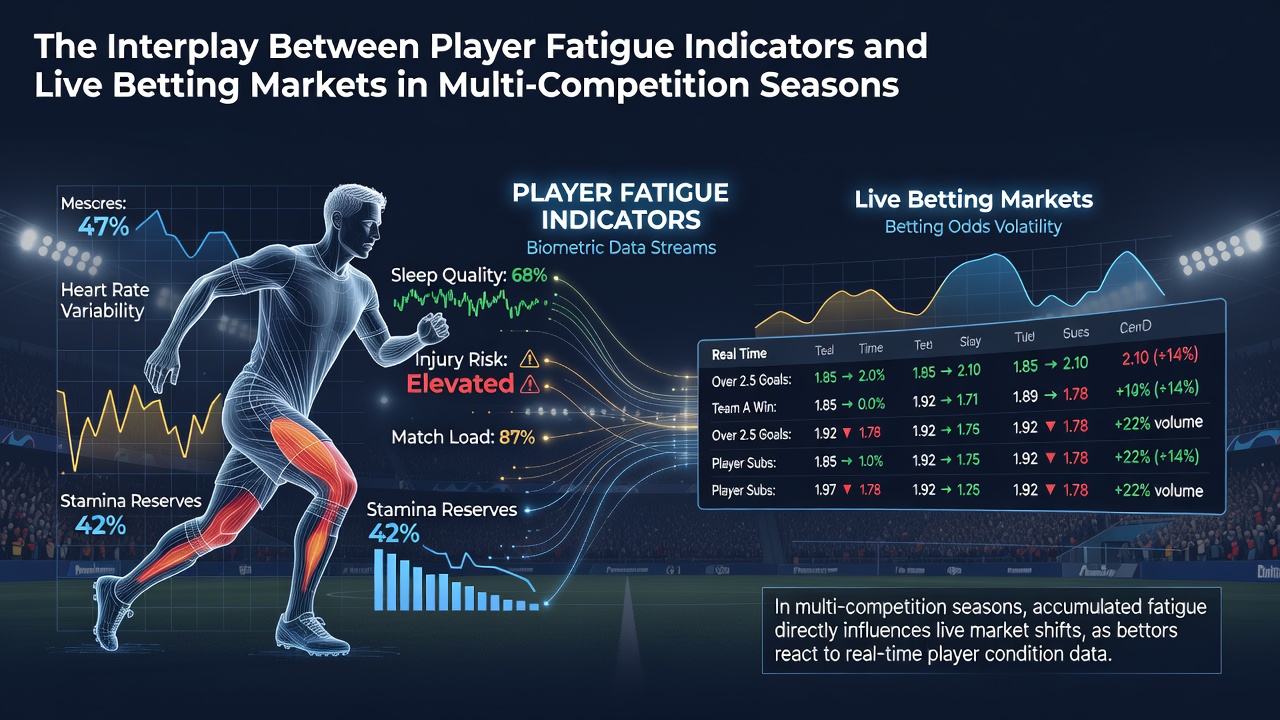
European football calendars pack league fixtures alongside cup ties and continental campaigns, which creates extended periods of fixture congestion where teams rotate squads yet still expose key players to elevated workloads. Observers note that fatigue indicators such as total distance covered, high-intensity sprints completed, and recovery heart-rate variability begin to diverge from seasonal averages once a squad exceeds roughly 50 competitive matches. These metrics feed directly into performance models that bookmakers update in real time, which allows live markets to adjust probabilities on goals, cards, and substitutions within minutes of new data streams arriving from stadium sensors.
Core Fatigue Indicators Tracked by Analysts
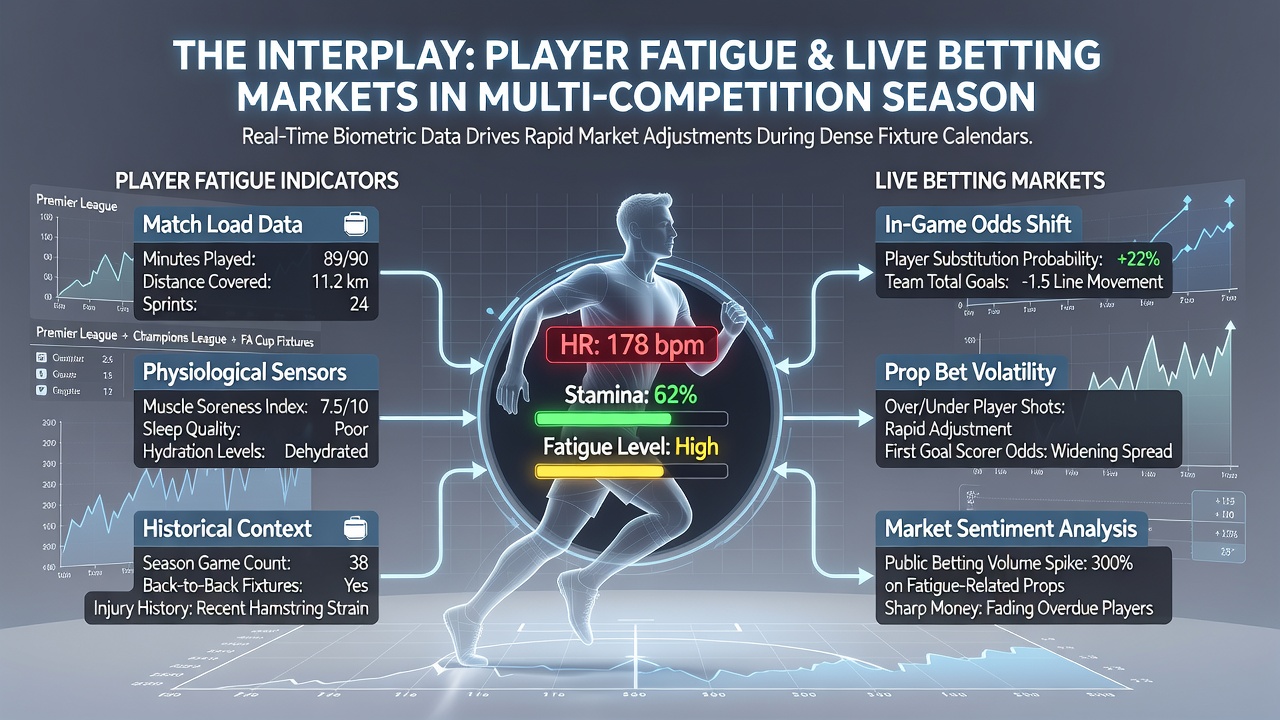
Medical staff across top divisions collect GPS and accelerometer data that quantify external load through meters run per minute and the number of explosive efforts above 25 km/h, while internal load appears through wellness questionnaires and blood markers like creatine kinase. When a midfielder logs more than 12 kilometers in three successive games, subsequent sprint frequency often drops by 8 to 12 percent according to aggregated figures from Bundesliga and Serie A clubs. Researchers at the German Sport University Cologne have published longitudinal studies showing that players with less than 72 hours between matches exhibit a measurable decline in passing accuracy during the final 30 minutes of the second half. Such patterns become visible to betting platforms that ingest the same anonymized tracking feeds, which lets them recalibrate in-play odds on over/under totals or next-goal timing before the 60-minute mark.
How Live Markets Respond to Detected Fatigue
Bookmakers integrate fatigue signals into algorithmic pricing engines that compare current match context against historical outcomes from similarly congested schedules. When a starting centre-back records a 15 percent reduction in high-speed running compared with his season mean, algorithms often shorten the odds on an opposing winger to score or assist in the closing stages. Data from the 2025-26 campaign across five major leagues revealed that teams averaging fewer than four full rest days between fixtures conceded 0.4 more goals per 90 minutes after the 75th minute than fresher opponents. Live bettors who monitor substitution patterns and player-tracking overlays can therefore identify moments when markets have not yet fully priced in the emerging physical decline. One study released by the Norwegian School of Sport Sciences examined 420 matches and found that live odds on late goals lengthened by an average of 0.35 decimal points within four minutes of visible fatigue markers appearing on broadcast graphics.
September 2026 Congestion Patterns
September 2026 opened with an unusually dense midweek schedule because both the expanded Champions League league phase and domestic cups overlapped with league rounds. Figures released by the European Club Association indicated that 68 percent of squads in the top five leagues played at least three matches inside eight days during the first fortnight of the month. Midfielders who featured in all three fixtures posted average recovery scores 22 percent below their baseline, according to aggregated wellness data shared by club medical departments. Live markets responded by moving totals markets earlier in the second half, particularly on matches involving squads with limited squad depth. Observers recorded that odds on over 2.5 goals tightened by 0.20 to 0.30 points within 10 minutes of half-time in games where both sides displayed elevated fatigue markers from the preceding midweek round.
Case Examples From Recent Seasons
Take a match between two sides contesting both league and European fixtures where one team’s primary holding midfielder completed 14 kilometers the previous Sunday and another 13 kilometers midweek. Broadcast tracking showed his high-intensity efforts falling from 42 to 29 between the 60th and 85th minutes. Live markets quickly adjusted the probability of a late counter-attack goal for the opponents from 18 percent to 27 percent, which created brief value windows for bettors watching both the physical data and the odds simultaneously. Another instance occurred in a Spanish cup tie when a side fielded the same back four for the fourth time in 12 days. The resulting increase in progressive carries allowed by that defence pushed live handicap lines by half a goal within 25 minutes of kick-off once early sprint data confirmed reduced recovery between presses.
Integration of External Data Sources
Platforms now supplement proprietary tracking with publicly available reports from organisations such as the Aspetar Orthopaedic and Sports Medicine Hospital in Qatar, which publishes periodic reviews on recovery timelines after repeated high-load exposures. Additional context arrives from academic repositories including the International Journal of Sports Physiology and Performance, where peer-reviewed papers detail how sleep disruption compounds physical load during travel-heavy continental weeks. These external datasets help refine the timing of live market movements, because they quantify the typical performance decay curve once cumulative load crosses established thresholds.
Conclusion
Multi-competition seasons amplify the visibility of player fatigue through measurable drops in physical output, and live betting markets incorporate those signals faster as sensor data and medical research become more accessible. The interaction produces observable shifts in in-play pricing that reflect real changes in team capacity rather than random variance. Continued refinement of load-monitoring protocols across leagues suggests that the relationship between fatigue indicators and dynamic odds will remain a central feature of betting analysis throughout future congested calendars.