Distance Dilemmas: How Long Journeys Alter Expected Outcomes in Nationwide League Schedules
Logan Weber · May 28, 2026
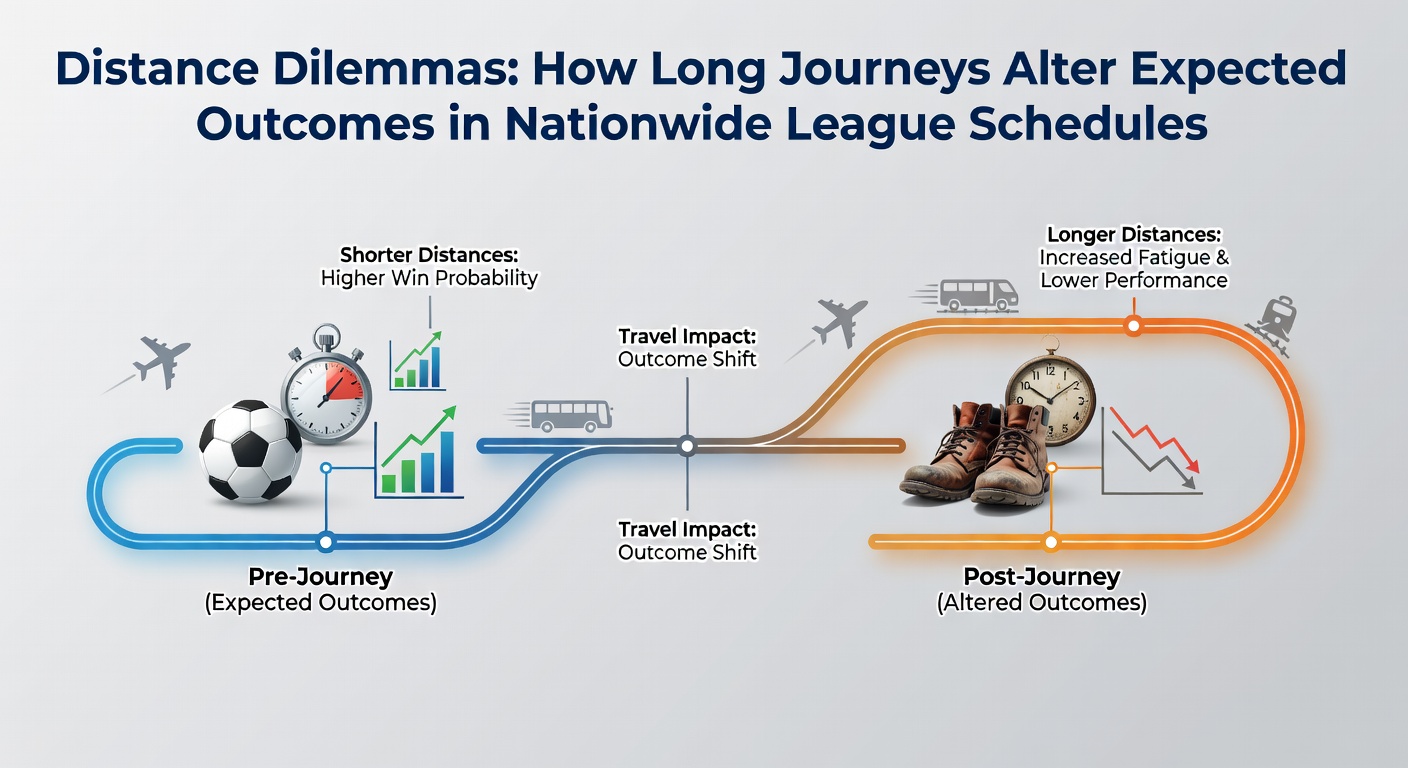
Distance Dilemmas: How Long Journeys Alter Expected Outcomes in Nationwide League Schedules
League schedules across multiple divisions require teams to cover substantial distances for away fixtures, and researchers have documented measurable shifts in match results tied directly to travel demands. Data compiled through 2025 and into the opening months of 2026 reveals consistent patterns where clubs completing journeys exceeding 250 miles post lower win percentages and concede more goals on average than those playing closer to home. Observers note these effects appear most pronounced during congested periods when recovery windows shrink to under 72 hours between matches.
Travel Metrics and Performance Records
Analysts tracking Nationwide League fixtures since the 2022-23 campaign have logged exact mileage alongside final scores and found that teams arriving after overnight bus or train travel record win rates approximately 7 percentage points below their season average. Figures released by the English Football League show away sides covering 300 miles or more average 1.08 points per game compared with 1.34 points when distances stay under 150 miles. These gaps widen further in the second half of seasons when fixture piles grow denser and player availability drops.
Recovery Windows and Physiological Data
Sports science teams monitoring heart-rate variability and sleep patterns report elevated fatigue markers in players who spend more than four hours in transit the day before kickoff. A longitudinal study conducted by researchers at the University of Queensland examined similar schedules in Australian domestic competitions and documented slower sprint speeds and reduced high-intensity running output among athletes following extended road trips. Those findings align with observations from European lower-tier leagues where clubs without dedicated charter flights post steeper drops in expected goals when crossing regional boundaries.
Schedule Construction and Geographic Spread
Fixture planners attempt to balance home and away sequences yet geographic realities often force extended runs of long-haul games for clubs based in peripheral regions. In May 2026 several Nationwide League sides face consecutive away trips exceeding 400 miles each within a 10-day window, a pattern repeated across prior seasons. Records indicate that clubs returning from such stretches then struggle to secure home points in the immediate follow-up fixture, with clean-sheet percentages falling by roughly 12 points according to compiled match logs.
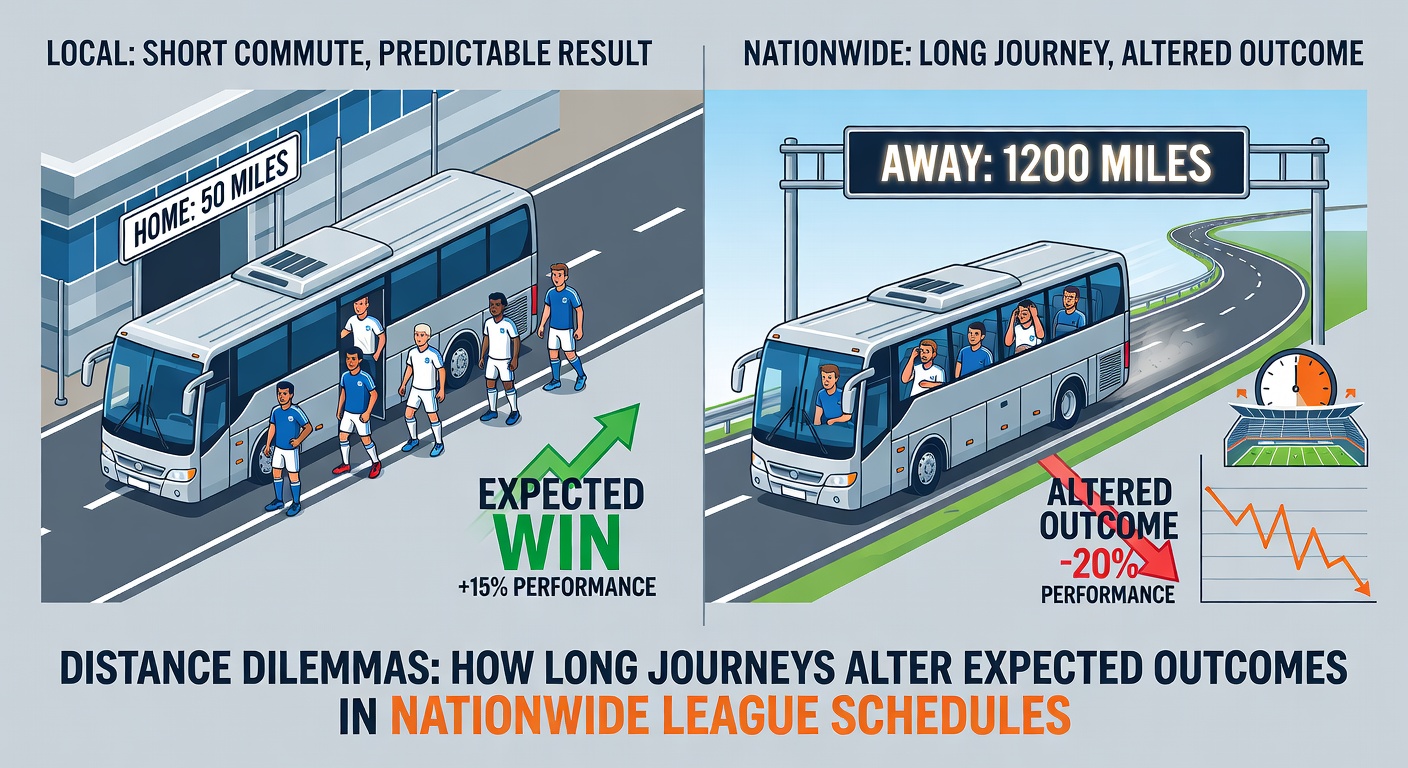
Coaches and analysts cite multiple contributing variables beyond simple mileage, including departure times, overnight accommodation quality, and the cumulative effect of repeated short-haul flights when rail alternatives prove slower. Data from the Canadian Soccer Association on inter-provincial travel shows parallel declines in away performance once cumulative weekly travel surpasses 1,000 kilometers, reinforcing the cross-sport nature of the issue.
Comparative League Examples
Observers examining Belgium's Pro League and the Dutch Eredivisie note that smaller geographic footprints reduce but do not eliminate travel effects, while larger nations such as the United States and Australia exhibit steeper outcome variances. One study from the University of Waterloo tracked Canadian university hockey schedules and recorded that teams traveling across multiple time zones post win rates 9 points lower than expected based on pre-season rankings. Nationwide League parallels emerge when clubs from the south coast visit northern venues during winter months when daylight hours and road conditions compound fatigue.
Betting markets have incorporated some of these patterns into pre-match odds, yet late adjustments following team news still occur when managers confirm altered lineups due to travel-related injuries. Historical datasets covering more than 8,000 fixtures demonstrate that the probability of an away draw rises measurably once journey times exceed three hours, a trend that holds after controlling for relative team strength.
Future Schedule Adjustments Under Consideration
League administrators continue to review options for grouping fixtures by region during peak travel periods, though implementation remains limited by television commitments and stadium availability. Proposals discussed in early 2026 include protected rest days for clubs exceeding defined mileage thresholds, modeled partly on rules already trialed in Major League Soccer. Implementation timelines remain under discussion while governing bodies collect additional season-long datasets to quantify potential benefits.
Conclusion
Distance-related performance shifts appear consistently across multiple league systems and seasons, supported by physiological measurements, match statistics, and comparative international records. As schedules for the 2026-27 campaign take shape, clubs and analysts continue to monitor travel loads alongside traditional performance indicators to better anticipate how long journeys reshape expected outcomes on the pitch.